VAS x PMAX | Cloud Reporting System for Enrollment Analytics
A BigQuery case study in reconciliation, warehouse modeling, and decision-ready reporting
From Enrollment Data
to a Cloud Reporting System
I turned spreadsheet-based campaign and CRM reporting into a BigQuery workflow with SQL models, reconciliation logic, dashboards, and SLA tracking.
1. Analytical scope and build
Data foundation Google Sheets to BigQuery Built one analytics foundation from separate campaign, lead, and CRM files.
SQL modeling 53 SQL assets Created reusable source, clean, rules, and reporting layers instead of spreadsheet joins.
Decision outputs Looker Studio reporting Published executive, media, reconciliation, and SLA views from trusted datasets.
Monitoring layer Audit and SLA tracking Made follow-up delays, missing matches, and review queues visible in the data model.
2. Problem framing
The team needed reporting they could trust across campaign delivery, CRM follow-up, and SLA monitoring.
Why this project
Business Need
- From 2024 to 2026, the enrollment workflow kept growing.
- Campaign data lived in agency files, while outcomes lived in Salesforce.
- Spreadsheet joins made KPI and SLA reporting hard to trust.
How I solved it
Analytical Approach
- Move campaign, CRM, audit, and media data into BigQuery.
- Clean and match records across sources.
- Apply shared KPI, reconciliation, and SLA logic in reusable SQL models.
3. Collaboration model
This project connected two working teams. PMAX managed campaign delivery and lead capture, while VAS managed CRM follow-up and conversion. BigQuery became the shared layer between them.
PMAX
- Campaign execution across channels
- Lead capture and media performance data
- Top-funnel delivery and reporting inputs
VAS
- Salesforce CRM ownership
- Follow-up, qualification, and conversion updates
- Enrollment operations and admission feedback
Campaign data, CRM outcomes, audit logic, SLA rules, and media actuals are standardized into one governed model.
What I built
Connected sources
Inputs
- Campaign capture
- Salesforce CRM
- Audit inputs
- Media actuals
SQL model
Core Logic
- Clean and standardize fields.
- Reconcile with Salesforce.
- Apply stage, KPI, and SLA rules.
- Create reporting-ready views.
Decision outputs
Published Outputs
- Funnel reporting
- SLA monitoring
- Audit queue and export
- Media plan vs actual
4. Warehouse data model
The warehouse replaced spreadsheet joins with a layered SQL model for ingestion, transformation, business rules, and reporting.
Raw tables and snapshots for inbound business data.
Parsing, normalization, and cleaned analytical fields.
Lead funnel base tables and shared analytical grain.
SLA, operational, audit, and KPI business logic.
Decision-ready datasets for funnel, SLA, audit, and media reporting.
Reusable rule layer
Key Business Logic
01_sla_3_days_audit03_stage_mapping04_operational_status06_weekly_audit_candidate_base
Reporting outputs
Key Datasets
12_rpt_data_quality_flags15_rpt_duplicate_analysis21_rpt_audit_export_weekly29_rpt_media_plan_vs_actual_daily
5. Analytical outputs
These four outputs supported most day-to-day work: funnel visibility, channel movement, reconciliation, and SLA monitoring.
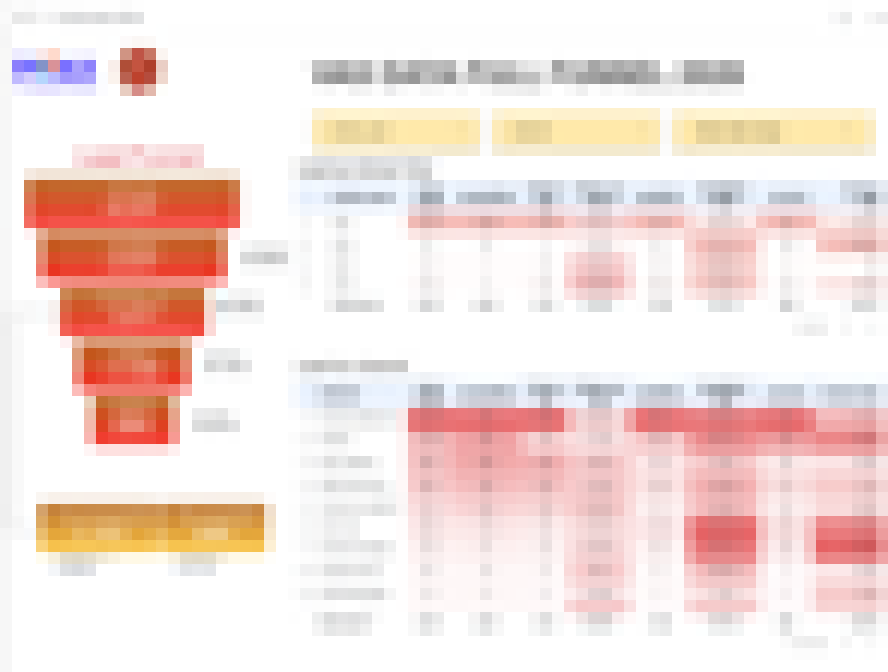
Executive funnel view
Management summary for plan, media activity, qualification, and funnel status in one page.
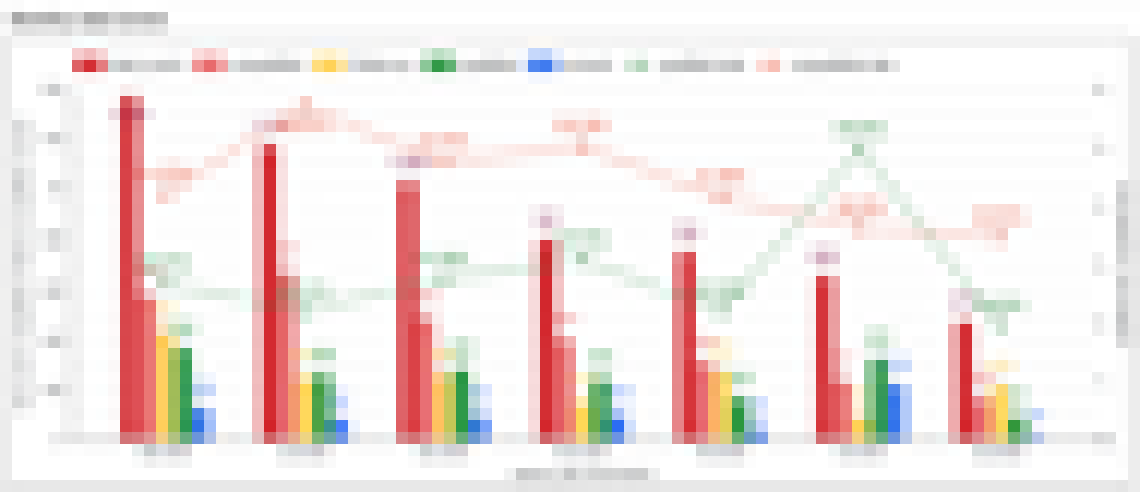
Lead by channel
Channel comparison for lead volume and quality movement over time.
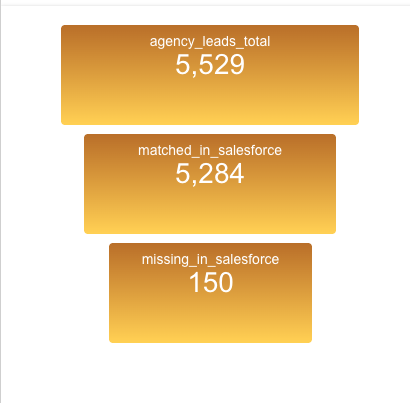
Lead reconciliation map
Gap analysis between agency lead capture and Salesforce matched records.
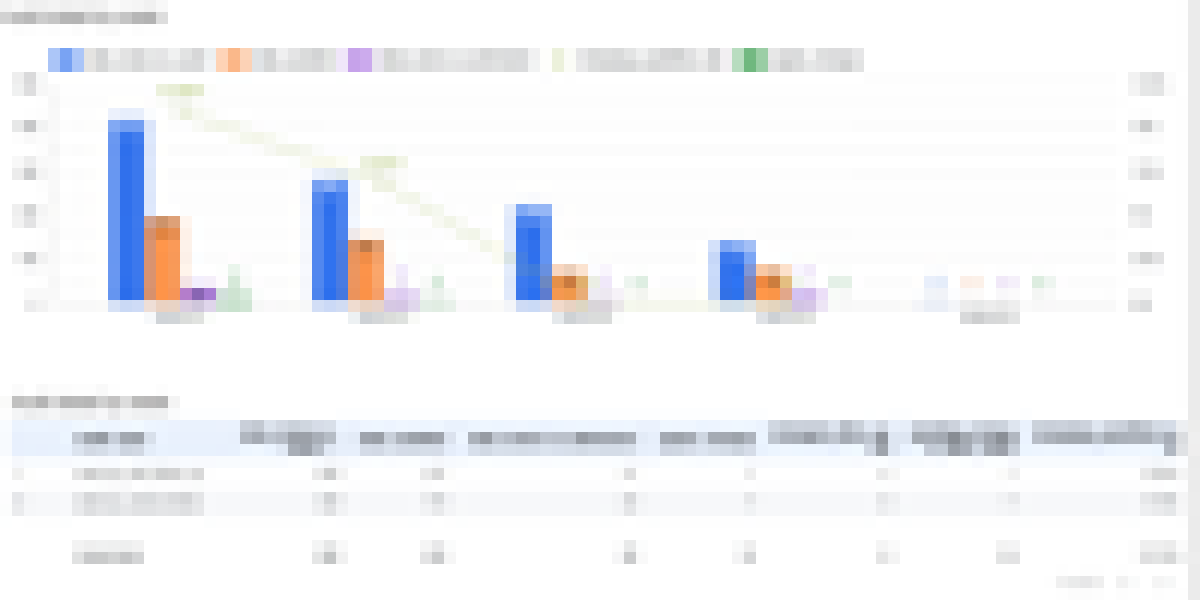
Quality flag and SLA view
Operational view for follow-up delay, exception handling, and review workflow.
Technical proof
This section shows that the project is backed by a real warehouse build, not only dashboard screenshots.
Warehouse footprint 53 SQL assets Built across source, clean, fact, rules, and reporting layers.
Reporting build 29 objects Reporting tables rebuilt in one successful sync cycle.
Snapshot evidence 5,911 CRM rows Salesforce rows inserted in one snapshot run, alongside 5,529 agency rows.
Operational export 703 audit rows Weekly audit candidates exported from BigQuery in one cycle.
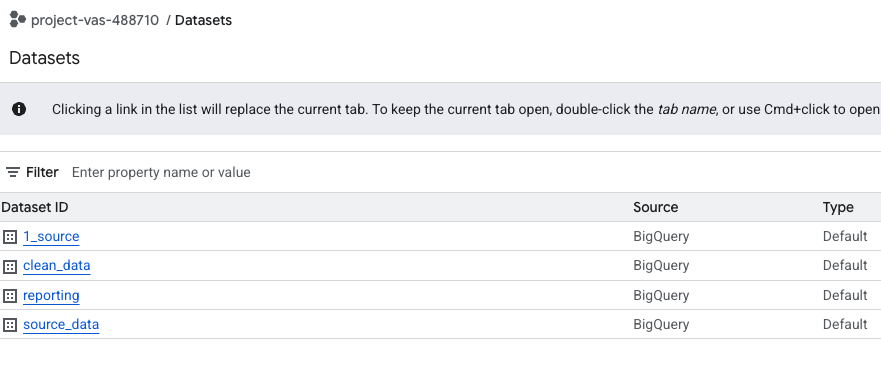
BigQuery warehouse
Datasets, warehouse objects, and reporting outputs deployed in the cloud environment.
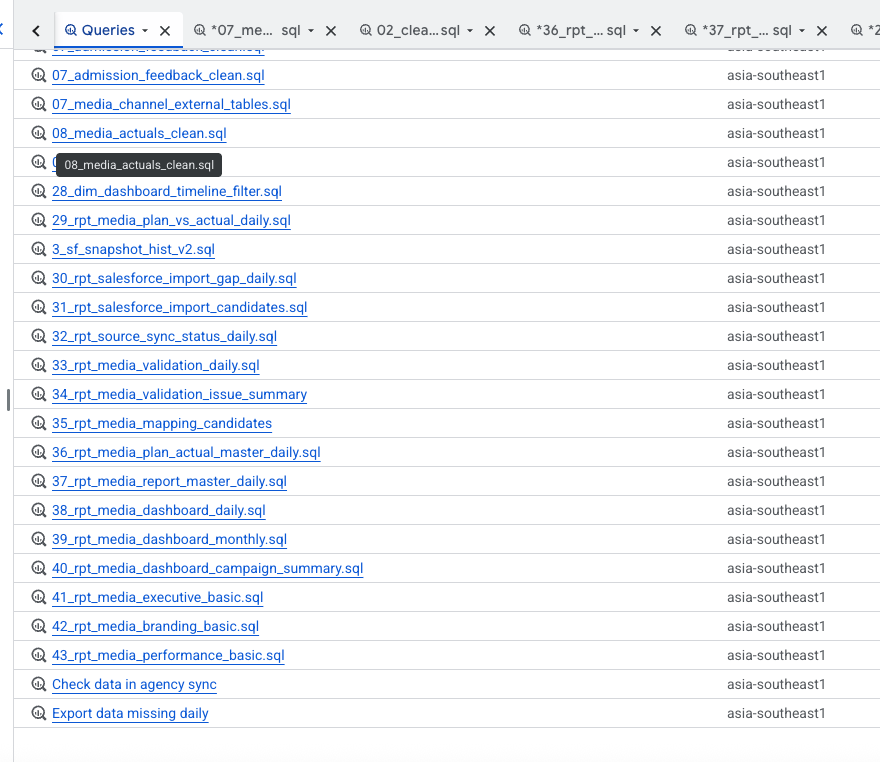
SQL model footprint
The warehouse is supported by a real SQL build path, not a dashboard-only demo.
Representative SQL logic
The warehouse uses business-fit cleaning and mapping logic. A common pattern is standardizing contact fields, mapping funnel stages, and flagging SLA risk in one reusable query.
SELECT
  lead_id,
  REGEXP_REPLACE(phone_raw, r'[^0-9]', '') AS phone_clean,
  LOWER(TRIM(parent_email)) AS email_clean,
  CASE
    WHEN sf_stage IN ('Qualified', 'Interviewed', 'Consulted') THEN 'Qualified'
    WHEN sf_stage IN ('New Lead', 'Contacted', 'Follow Up') THEN 'Active Follow-up'
    ELSE 'Other'
  END AS stage_group,
  DATE_DIFF(CURRENT_DATE(), last_followup_date, DAY) AS days_since_followup,
  CASE
    WHEN DATE_DIFF(CURRENT_DATE(), last_followup_date, DAY) > 3 THEN 1
    ELSE 0
  END AS is_over_sla_3bd
FROM lead_funnel_base
WHERE school_year = 2026;6. Project takeaways
This project works best as an analytics engineering case study. It turns messy business inputs into trusted data products.
Business-fit cleaning
Clean for How the Business Works
- Standardize phone, email, date, and source fields before analysis.
- Handle duplicates across school years, channels, and admissions workflows.
- Reduce spreadsheet naming drift that breaks reporting consistency.
Mapping and business rules
Map Data into Business Language
- Group CRM stages into clear funnel categories.
- Translate follow-up timing into SLA status and priority bands.
- Keep KPI definitions in reusable logic instead of manual formulas.
Predictive potential
Use Collected History for Prediction
- Historical snapshots support lead conversion modeling.
- Follow-up lag and operational fields can support SLA-risk prediction.
- Audit patterns can later support review-priority scoring.
Data and visualization design
Optimize What Users Actually See
- Separate executive views from operational monitoring views.
- Keep charts simple by reading from one governed layer.
- Improve trust by showing fewer, more useful visuals.